
Incident Investigations: A Problem-Solving Process
by Jerome E. Spear, CIH, CSP, FAIHA
Heinrich’s study in 1931 concluded that for every serious injury, about 29 minor
injuries occur with 300 other occurrences that produce no injury (Heinrich 90). In another
study, Bird and Germaine showed a 500:100:1 relationship among property-damage
accidents, minor-injury accidents, and disabling injury accidents (Bird and Germain 21).
Fletcher reported a ratio of 175:19:1 for no-injury accidents, minor-injury accidents, and
serious injury accidents (Fletcher 37). Although the precise ratios of these studies differ to
some extent, one point is demonstrably clear – a large proportion (i.e., greater than 80%) of
accidents are neglected if we only respond to those events that result in an injury. Therefore,
since the only difference between an incident resulting in no injury and a catastrophe may
have been by chance, every problem should be investigated and resolved (Goldberg 33).

Within the context of this paper, the author defines an “incident” as a deviation from
an acceptable standard or work practice (i.e., an organizational “problem”). The goal of a proactive organization would be to investigate such problems to their root causes. However, in the author’s opinion, organizations are often faced with the two barriers keeping them from doing so:
-Employees do not like to report incidents to management, perhaps due to fear of being blamed for the incident.
-Even those organizations that have an advanced safety culture, with employees who openly report incidents, typically do not have enough resources to thoroughly investigate all of these incidents to their root causes.
The first barrier may be addressed by training and on-going communication with employees at all levels acknowledging the importance of reporting and investigating incidents. With few exceptions, management should not blame an employee for having an injury or being involved in an incident. Such actions are counterproductive and can cause employees to be fearful of reporting future incidents. An alternate way to identify potential problems to investigate include conducting periodic audits and inspections.
When the safety culture supports incident reporting without fear of blame, the organization is headed in the right direction. The problem then often becomes the limited resources to investigate these incidents. To address this situation, incidents should be evaluated and subsequently prioritized by risk. Those incidents associated with the highest risk should receive the highest attention priority.
Prioritizing Incidents
Incident investigation is a problem-solving process, and for most technical professionals, problem solving is a primary job function. All agree that identifying the right problem to solve is often the most difficult step in the task (Adams 22).
Statistical process control applies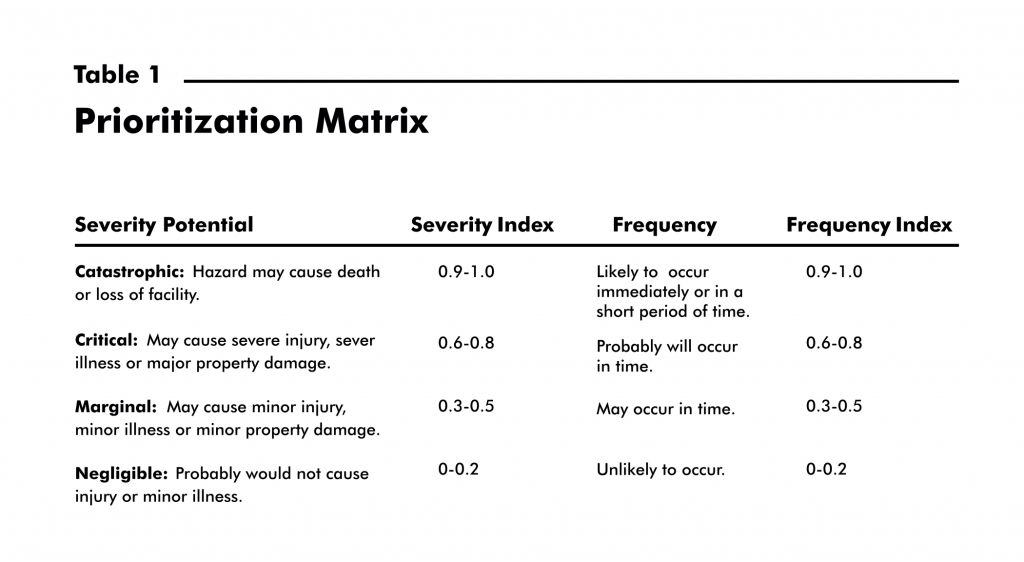
statistical techniques to determine whether observed variations within the safety process are due to “common causes” or “assignable causes.” Common cause variations are inherent to a process when it is operating as designed. Assignable cause variations are unnatural variations within a process (Sower 53). Regardless of whether the safety process is “out-of-control” or “in statistical process control,” there are undoubtedly numerous incidents (and numerous problems) occurring each day. As with other business scenarios, the time spent investigating incidents must be prioritized.
Early in the incident investigation process, a useful quality management tool is a prioritization matrix. A prioritization matrix allows comparison of both quantitative and qualitative data within the same analysis (Sower 44). The prioritization matrix is a risk management tool used in the safety field, since it evaluates both severity potential and frequency of an incident or hazard. Risk is defined as the product of the frequency and severity of potential losses (Brauer 527). A way to prioritize incidents by risk is to categorize each incident with the appropriate severity and frequency weightings. The author provides (Table 1) severity potential and frequency weightings that may be used when developing a prioritization matrix.
Root Cause Analysis
Quality management techniques teach us that the identification of root causes in any system is fundamental to problem solving and continuous improvement (Senecal and Burke 63). Two approaches to solving a problem include application of unstructured and structured methods. Unstructured problem-solving techniques include intuition, networking (i.e., lessons learned), and experience. Structured techniques include the systematic tools used in root cause analysis. Root cause analysis is a systematic
process of:
-defining the problem,
-gathering and prioritizing data about the problem,
-analyzing solutions to the problem, and
-evaluating the benefits versus the cost-effectiveness of all available prevention options (Handley 75).
These structured problem-solving tools include the following:
-Change Analysis
-Hazard-Barrier-Target Analysis
-Events and Causal Factors Charting
-Tree Diagrams
-Cause-and-Effect Diagrams
According to Adams (22), problem solving is not unstructured thinking. However, there may be times when an unstructured approach is the most feasible option, such as when investigating incidents that have a low severity potential and a low frequency rating. If the incident has a rating greater than 0.20 on the prioritization matrix (using the severity and frequency ratings shown in Figure 1), structured
problem-solving techniques should be used.
Change Analysis
The premise of change analysis is consistent with the words of the Greek philosopher Heraclitus, “there is nothing permanent except change.” Since change is constantly occurring around us, the likelihood of an incident increases if change is not properly anticipated and/or controlled. The purpose of change analysis is to identify the cause(s) of the mishap by exploring differences between the problem situation and a problem-free situation.
There are three ways that change occurs (Wilson, Dell, and Anderson 114):
1. Mandated
2. Naturally (whether noticed or not)
3. Caused (knowingly or not)
For mandated change, we can look at how the change was implemented. For instance:
-What was the magnitude of the proposed change?
-Was the implementation complete?
-Were reinforcing factors considered and included as part of the change implementation?
If the change occurred naturally or was caused, the difference between an incident and a similar problem-free situation, typically is not readily obvious.
Change analysis may be performed in either a reactive mode (e.g., incident investigations) or a proactive mode (e.g., identifying the potential effects of changes prior to implementing a new procedure).
The following steps are conducted in a change analysis (Ferry 163):
1. Define the problem.
2. Identify a “problem-free” situation.
3. Describe the conditions and compare.
4. Determine the direction and amount of the changes.
5. Examine the changes for their effect on the problem.
6. Sort out the causes from the problems.
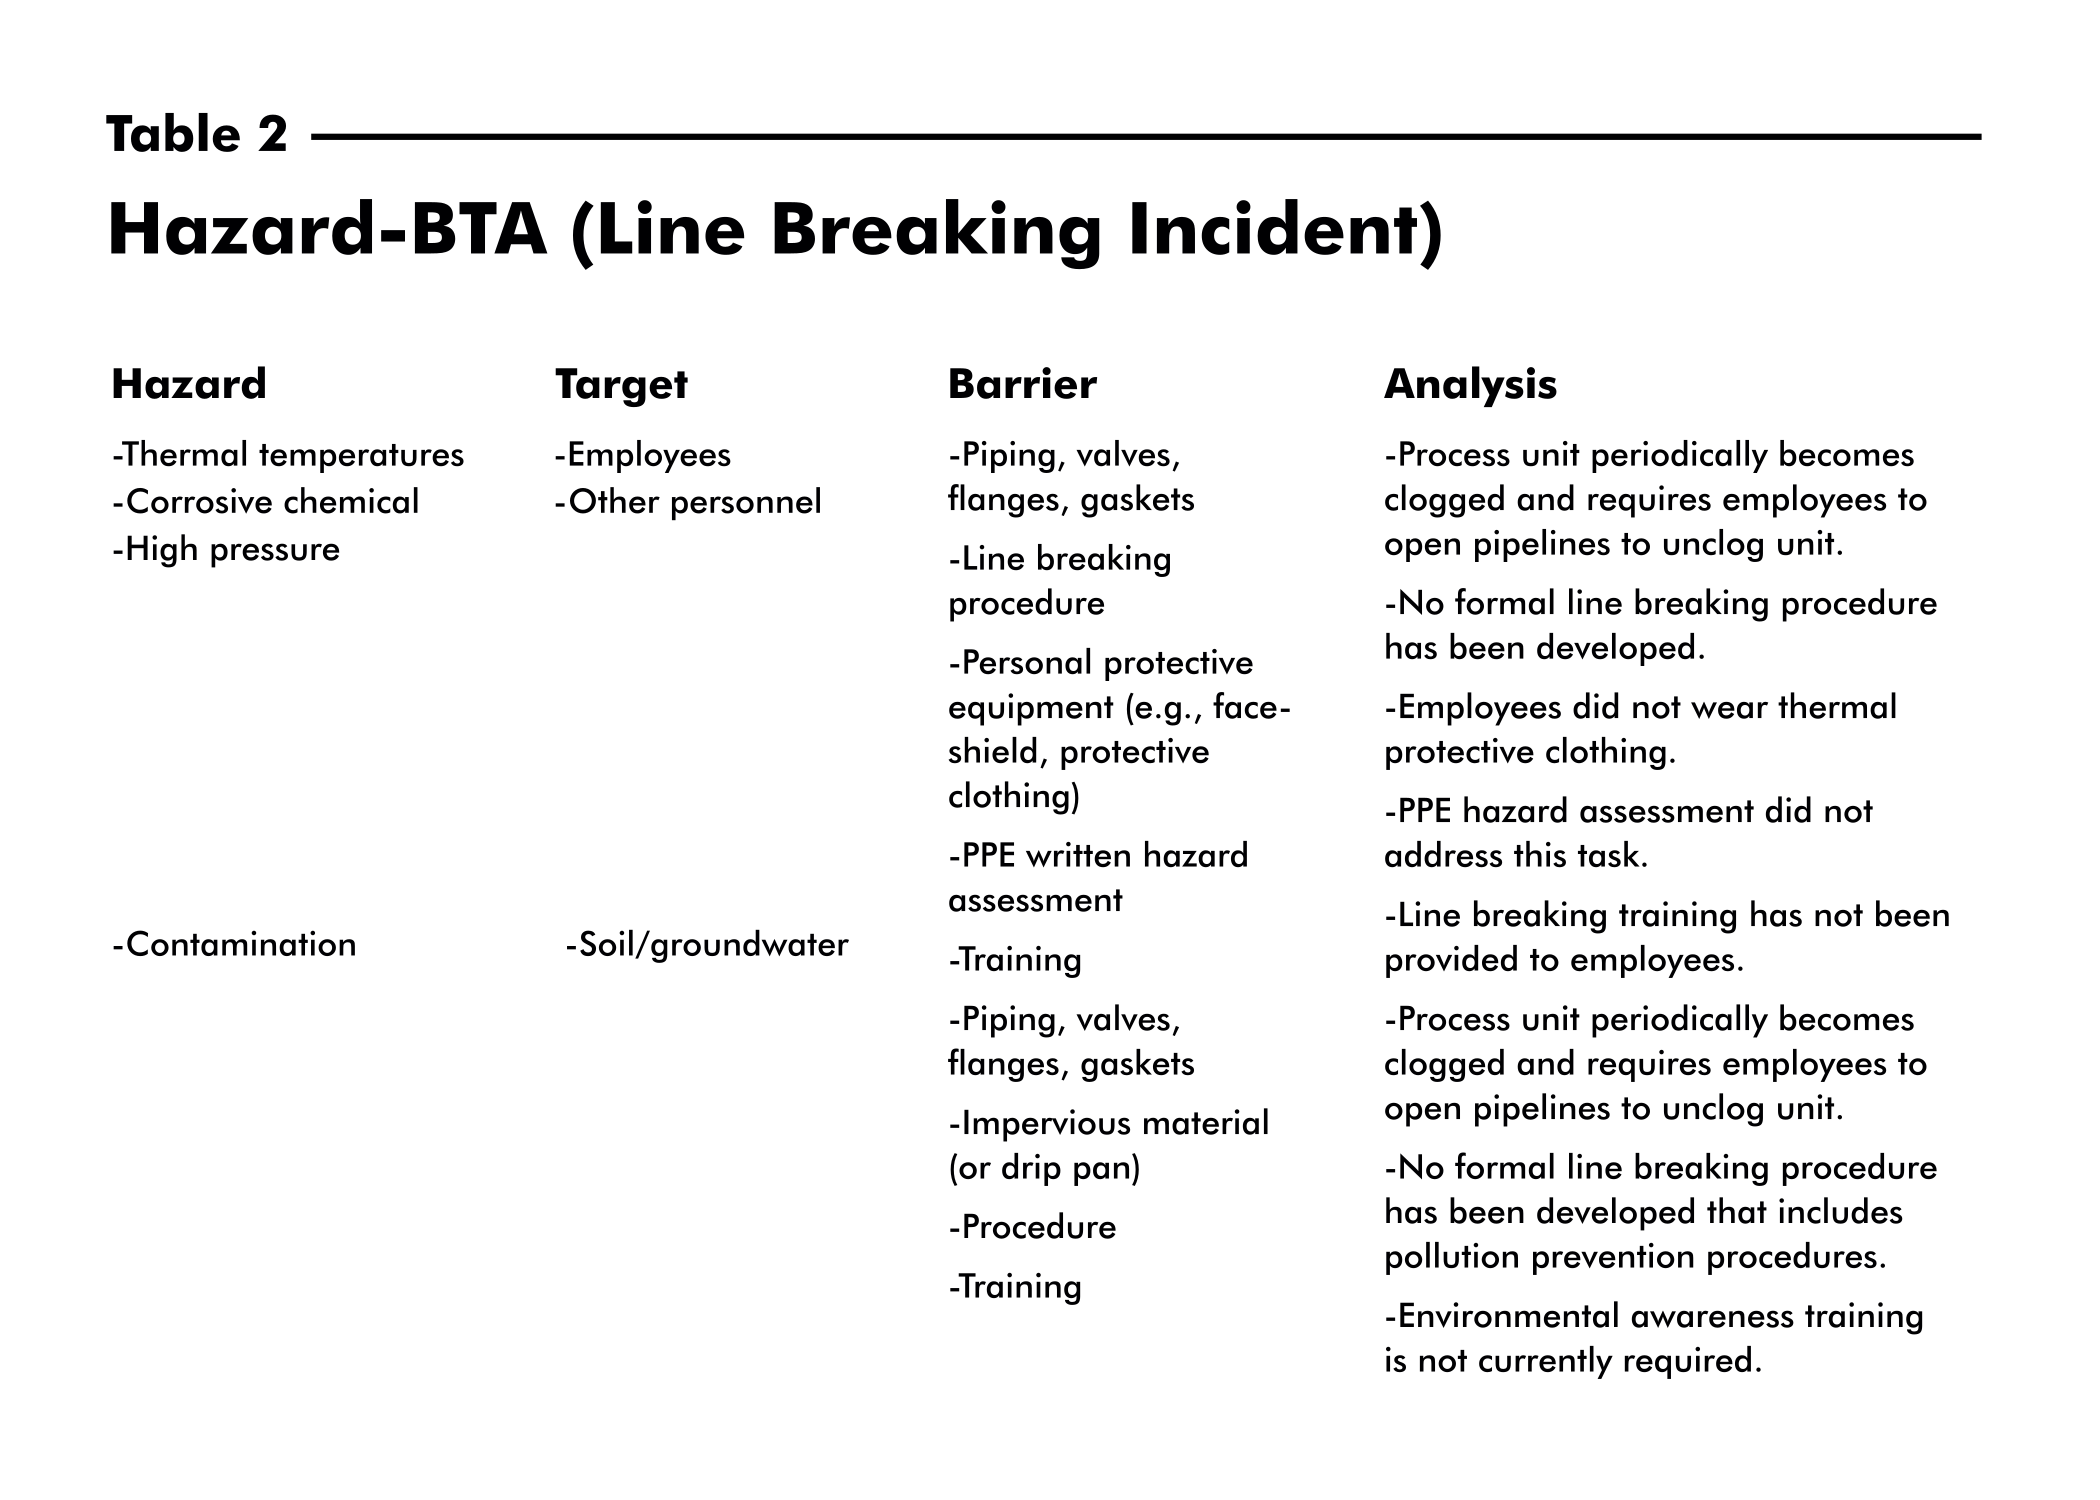
Hazard-Barrier-Target Analysis (Hazard-BTA)
A hazard-BTA looks at the potential hazards, how the damage occurs, and assesses the adequacy of any installed barriers or other safeguards that should either prevent or mitigate an incident. Like change analysis, the hazard-BTA may be used either as a reactive tool or as a proactive tool. In order for an incident with a damaging outcome to occur, there must be a TARGET, a HAZARD, and a less-than-adequate BARRIER. By identifying the potential hazards along with the possible targets, an analysis of the barriers can be conducted. A target is something of value and may be a person, part, system, procedure, or process. A barrier separates the target from the hazard and may be physical (such as personal protective equipment, machine guards, or safety valves), administrative (procedures or directives), or personal (training and supervision) (Wilson, Dell, and Anderson 133). For example, two employees were opening a process line at a flange joint in order to unclog the line. As the line was opened, the line became unclogged and product inside the line splashed the workers, causing both employees to receive multiple 2nd and 3rd degree burns. A hazard-BTA (Table 2) proved to be an efficient assessment tool and provided valuable information in a relatively short period of time.
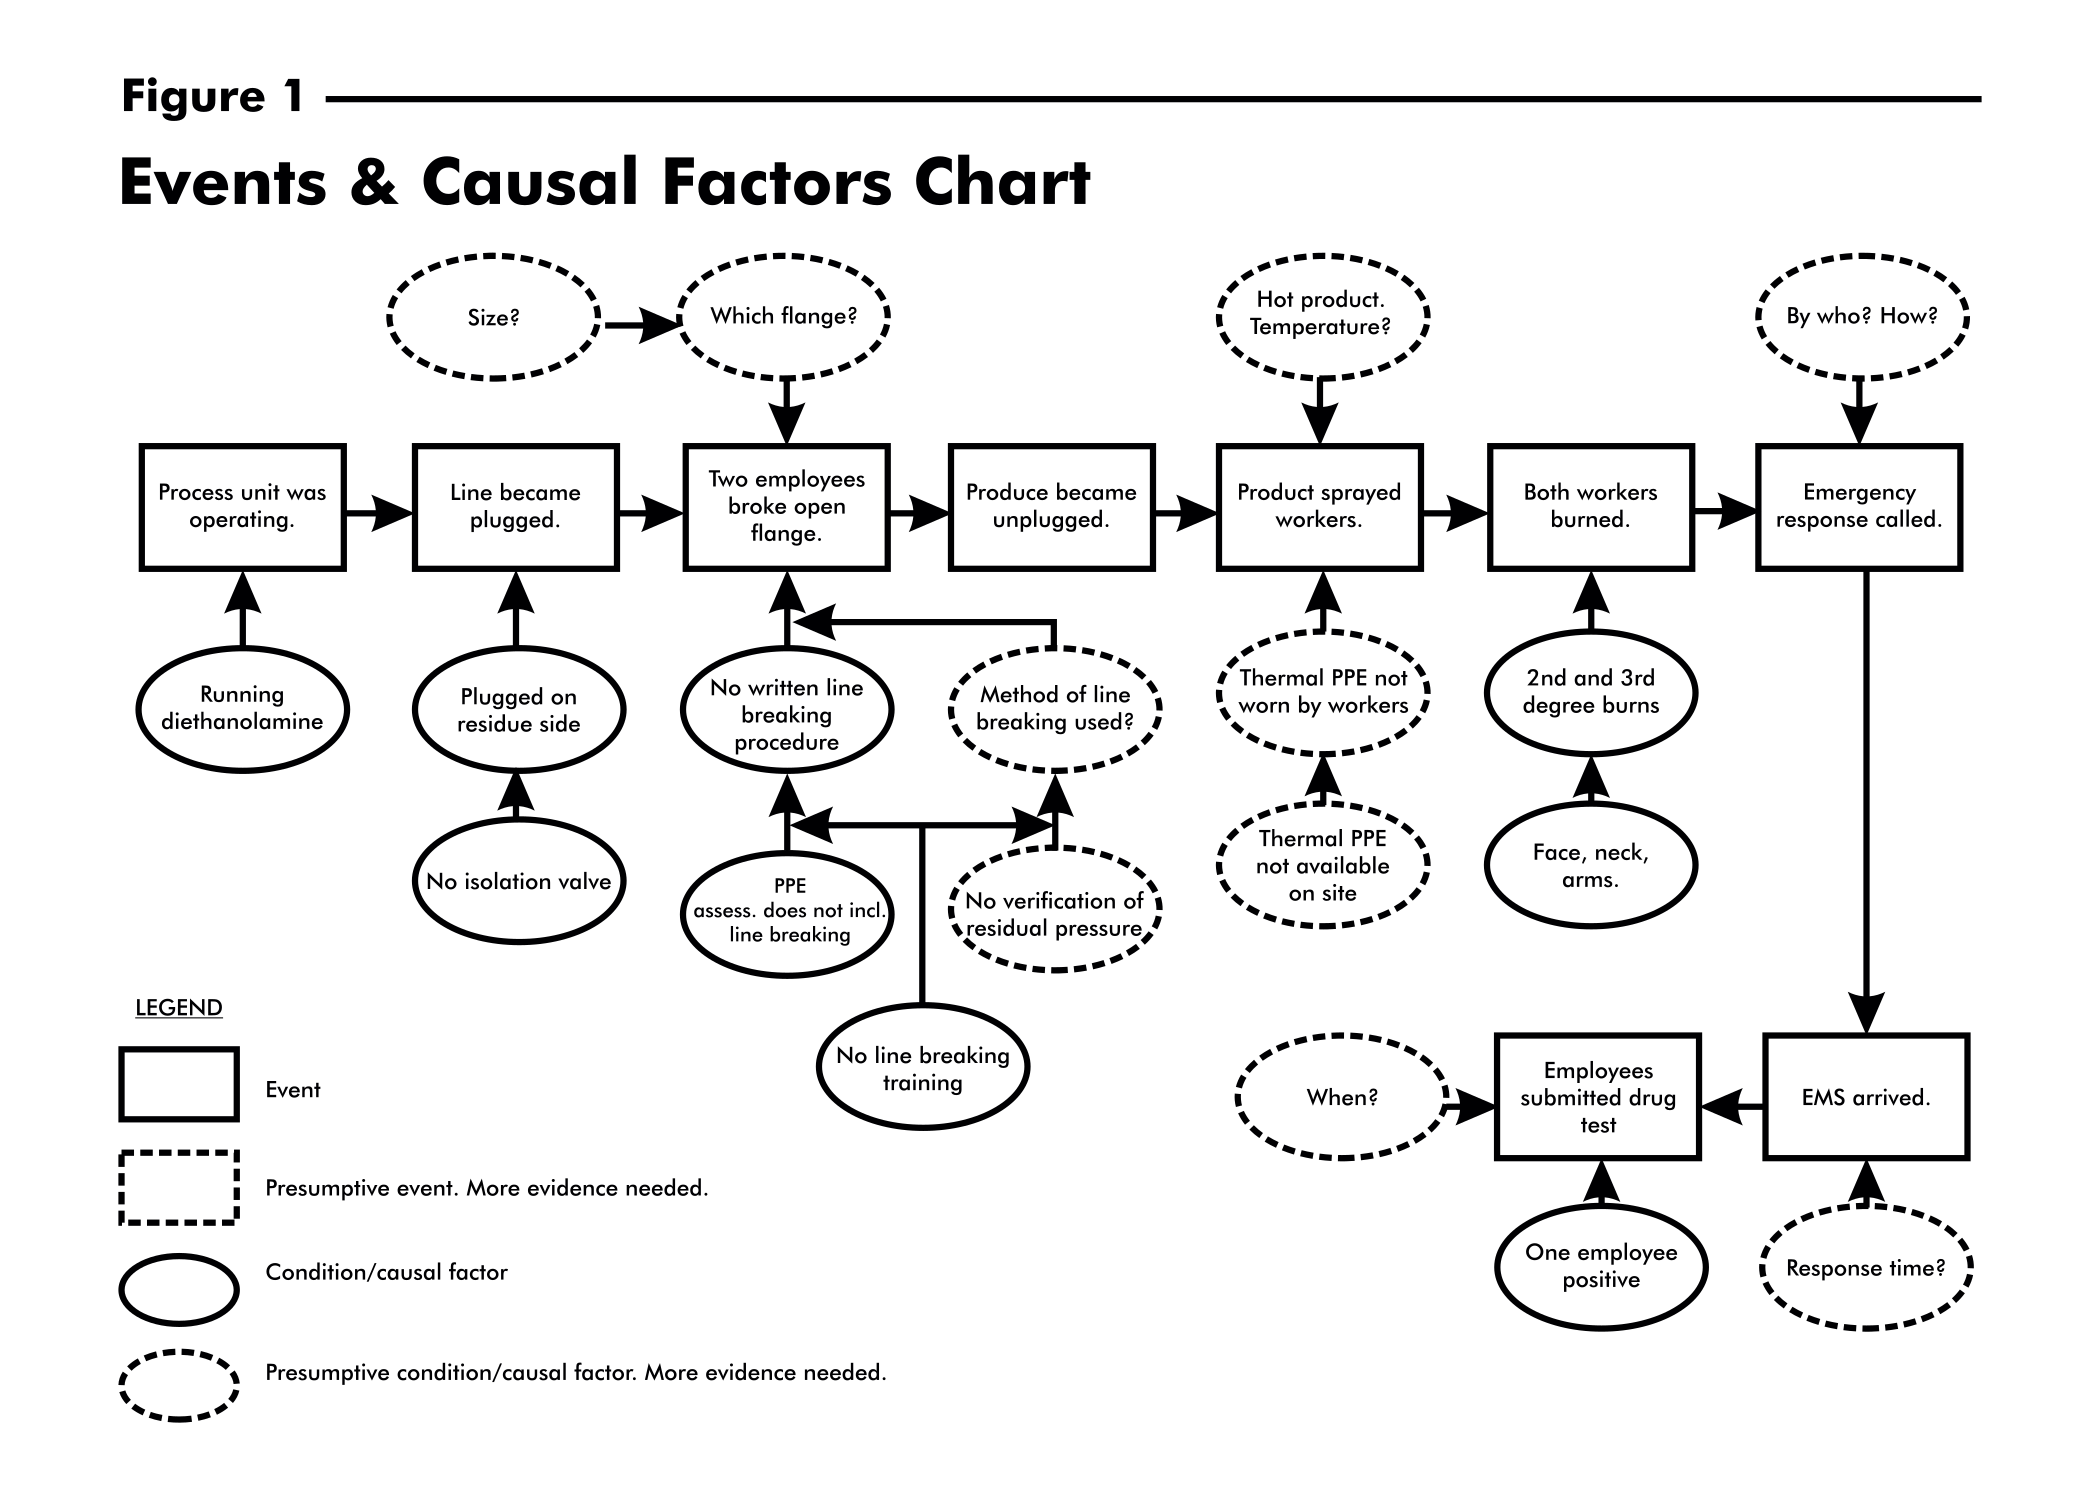
Events and Causal Factors Charting (E&CF)
Wilson Dell, and Anderson (42) cite events and causal factors (E&CF) charting as the best root cause analysis tool to employ when faced with investigating an injury or other damaging consequence. It is especially useful when documenting the chain of events is important. An E&CF chart is essentially a flow chart that depicts the sequence of events leading up to the event causing the injury or property damage and assesses the emergency response activities. For each event, relevant causal factors or conditions are identified and noted on the flow chart. The goal is to uncover the root causes for as many of the preceding events that will break the chain of events leading to the injury or other negative outcome. An events and causal factors chart is illustrated in Figure 1.
Tree Diagrams
A tree diagram is a graphical display of an event that describes the contributing factors of each event. Examples of tree diagramming techniques include the Fault Tree Analysis (FTA) and Management 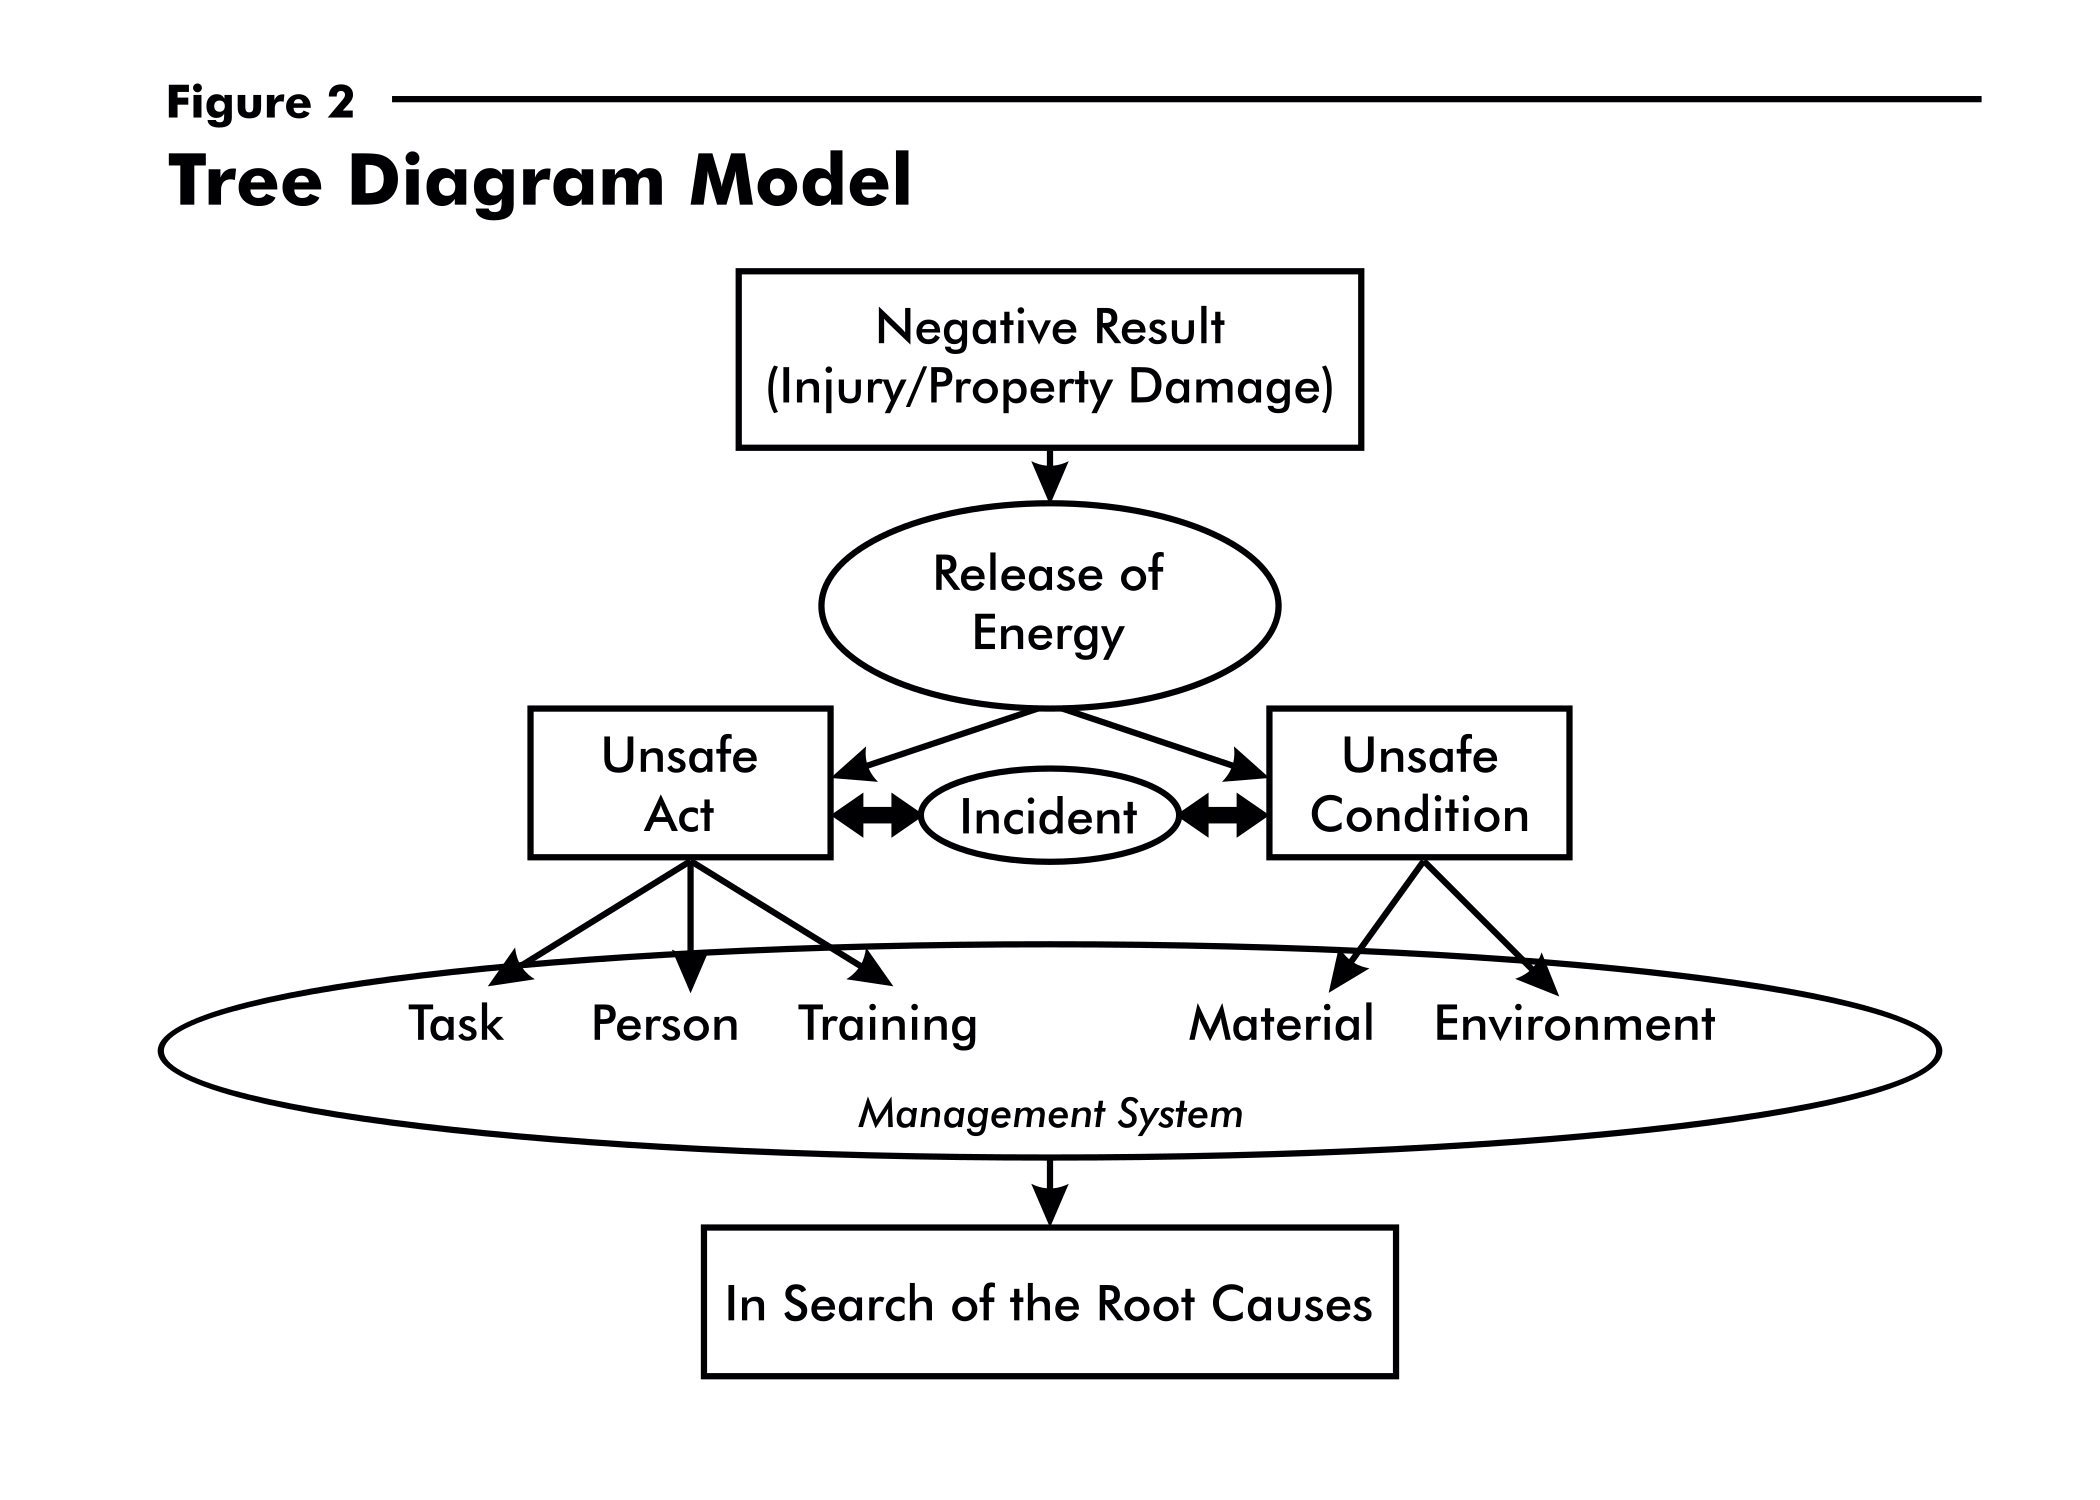 Oversight Risk Tree (MORT). Both of these applied techniques include standardized symbols in the construction of the tree diagram. A modified approach that categorizes root causes by the management system is based on the model in Figure 2. The concept of this model is that incidents are events that have the potential of causing injury or damage and are caused by unsafe acts and/or conditions. Unsafe acts and unsafe conditions are merely symptoms of overall organizational problems. The top event (usually an injury) is actually caused by failures within the management system (Stalnaker 37). Therefore, blaming employees for having an injury should be avoided. Rather than punish workers, management should strive to get to the bottom of these failures and correct the faulty management system – a system that did not anticipate or discover these failures before they caused an accident. With few exceptions, injuries are ultimately caused by management system failures, not employee infractions (Speir 29). Even if the injury resulted from an unsafe act, the supervisor (part of the management system) may have unknowingly encouraged the at-risk behavior(s).
The questions, as well as the construction of the tree diagram, should be continued until all of the relevant “whys” have been answered (Sorrell 40). Once the investigator reaches a point where management can no longer provide a corrective action to eliminate the preceding event, the root causes have been discovered for the respective “tree” branch. The root causes are located at the bottom of the tree and are the most fundamental causes that can be reasonably corrected to prevent recurrence of the error. Essentially, corrective actions must be able to be assigned to the root causes (Sorrell 40).
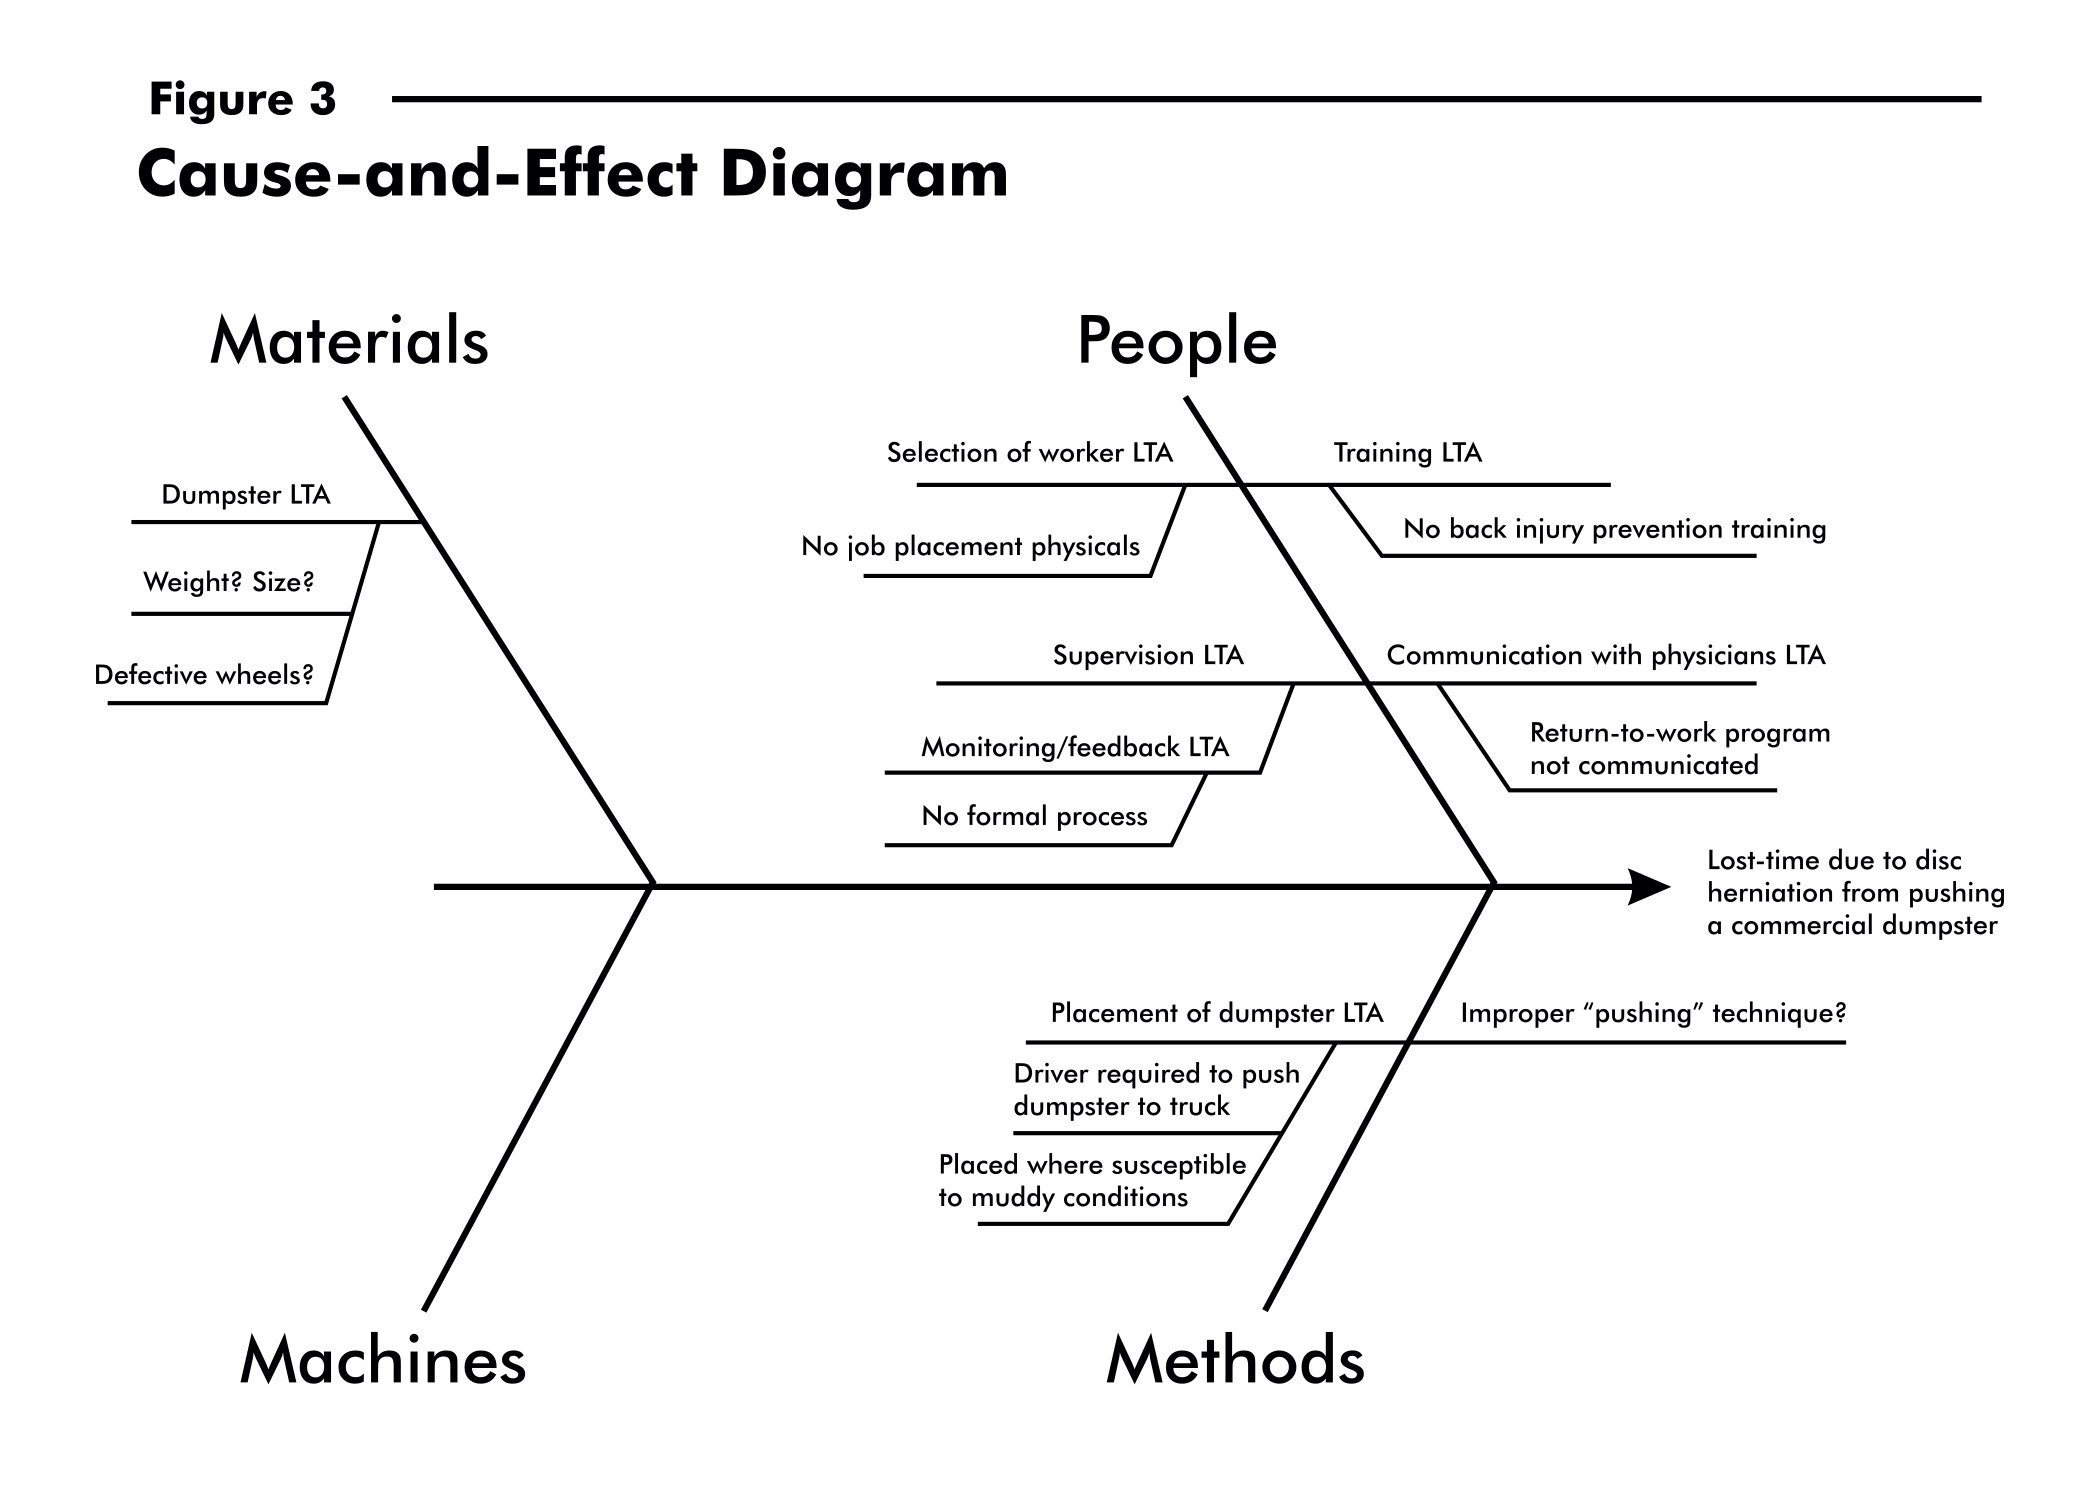
Cause-and-Effect Diagrams
A cause-and-effect diagram is another quality management tool useful in understanding how an incident occurred. This problem-solving tool is best used to facilitate a “brainstorming meeting” early in the incident investigation process to organize the ideas of possible causes. For example, when faced with investigating a lost-time injury incurred from pushing a commercial dumpster, a cause-and-effect diagram was constructed (Figure 3) during the preliminary stages of the investigation and the possible causal factors were listed. As more information and facts were obtained, the causal factors listed on the diagram were either confirmed or deleted.
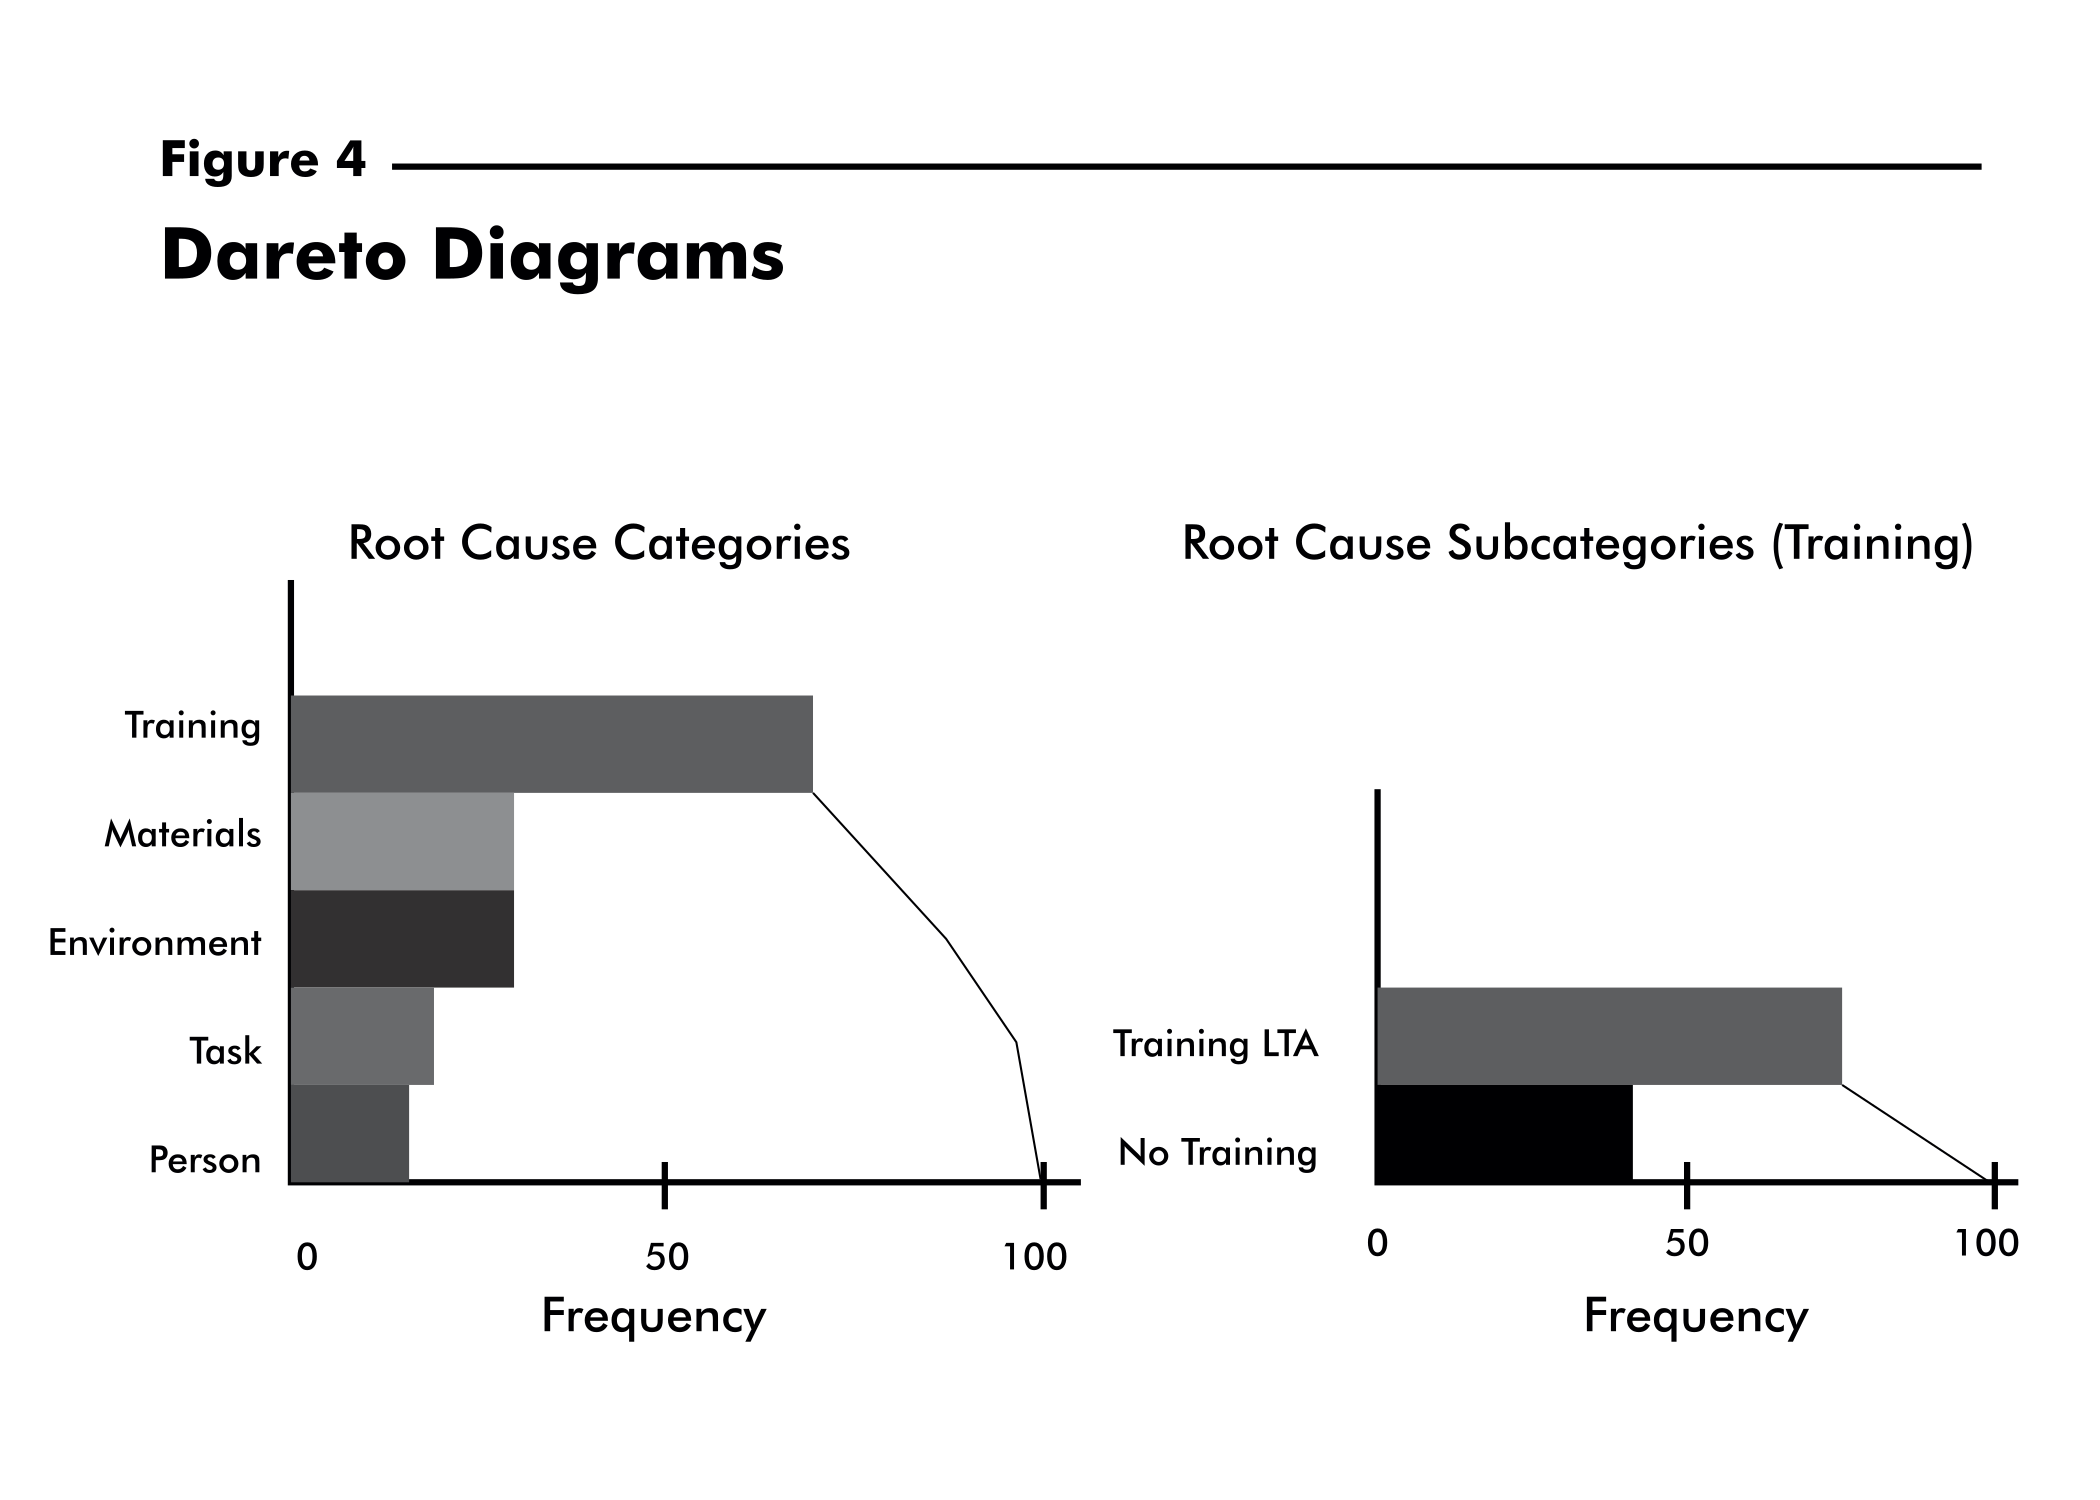
Trend Analysis
Trending analyses should include not only large incidents, but also incident precursors and all other safety
problems (Stalnaker 38). The data obtained from a well-established incident investigation process allows management to perform a trend analysis using a Pareto diagram (Figure 4). The Pareto diagram sorts the root cause categories from the highest frequency to the lowest and also identifies cumulative frequencies allowing management to better learn where available resources should be allocated.
 In conjunction with a Pareto diagram, a “run chart” can further track the root cause categories by month to ensure that improvement is being made. A run chart is a graphical representation of the variation in the root cause categories over time (Sower 36). The root cause categories is represented on the vertical axis, and the time periods are represented on the horizontal axis.
An important step with the problem-solving process often omitted is following up on corrective actions. A run chart provides a mechanism to indicate whether or not corrective actions are not only sufficient but also have been adequately implemented. Corrective actions may be misunderstood or the appropriate action may be taken initially, only to be discontinued later (Stalnaker 38) making follow-up essential.
Root cause analysis, as a quality improvement initiative is not a static process. Continual evaluation, measurement, follow-up, and review of the effectiveness of the solution are critical to ensuring that the root cause(s) of the problem was properly identified and that the problem does not recur (Handley 76).
Proactive companies continue to emphasize through education and actions, that it is imperative to report
every incident (or organizational problem) regardless of the outcome. If employees are blamed for having
injuries or reporting incidents, this problem-solving process can be seriously stifled. Structured analytical tools should be used to identify the root causes of an incident enabling appropriate corrective actions to be implemented. Once root causes are identified, management must follow up to ensure continuous improvement of the incident prevention process.
References
Adams, E. “The Quality Revolution: A Challenge To Safety Professionals.” Professional Safety. Aug. 1991: 22-28.
Bird F. Jr. and Germain, G. Damage Control. New York: American Management Association, 1966.
Brauer, R. Safety and Health for Engineers. New York: Van Norstrand Reinhold, 1990.
Ferry, T. Modern Accident Investigation and Analysis, 2nd ed. New York: John Wiley & Sons, 1988.
Fletcher, J. The Industrial Environment – Total Loss Control.
Willowdale, Ontario, Canada: National Profile Limited, 1972.
Goldberg, A. “Finding the Root Causes of Accidents.” OccupationalHazards. Nov. 1996: 33-39.
Handley, C. “Quality Improvement Through Root Cause Analysis.” Hospital Material Management Quarterly. May 2000: 74-78.
Heinrich, H. Industrial Accident Prevention: A Scientific Approach. New York: McGraw-Hill, 1931.
Senecal, P. and Burke, E. “Root Cause Analysis: What Took Us SoLong?” Occupational Hazards. Mar. 1993: 63-65.
Sorrell, L. “Accident Investigation: Back To Reality.” Professional Safety. Sep. 1998: 39-44.
Sower, V., Savoie, M., and Renick, S. An Introduction To Quality Management and Engineering. Upper Saddle River, NJ:
Prentice-Hall, Inc., 1999.
Speir, R. Jr. “Punishment in Accident Investigation.” Professional Safety. Aug. 1998: 29-31.
Stalnaker, C. “The Safety Professional’s Role in Corrective Action Management.” Professional Safety. Jun. 2000: 37-39.
Wilson, P., Dell, L., Anderson, G. Root Cause Analysis: A Tool for Total Quality Management. Milwaukee, WI: American
Society of Quality, 1993.